×

Joint-Venture Project

Jorf Lasfar Storage Terminal & Service Station Network


Operational and Financial Framework Presentation

May 2026

Executive Summary

A strategic partnership to capture Morocco's growing fuel & LPG market through integrated storage infrastructure and nationwide retail distribution.

90,000 m³
Storage Capacity at Jorf Lasfar
50
Branded Service Stations
649 M MAD
Total Project Investment
50/50
Equal Equity Partnership
10-Year Exclusive Supply Agreement
90-Day Payment Terms — No LC Required
Strategic Port Location (Jorf Lasfar)

The Partners & Legal Framework

The Partners

  • Party A (The Distributor): OPTIM OIL SARL (Casablanca, Morocco).
  • Party B (The Trader): Avant-Garde Commodities.

The Project Company

  • Legal Form: Société Anonyme (SA) incorporated under Moroccan Law.
  • Equity Structure: Strictly 50% - 50% ownership split.
  • Corporate Name: To be mutually agreed prior to incorporation.

Project Scope & Core Objectives

Vision: Establishing a major new player in the Moroccan fuel and LPG market.

Terminal

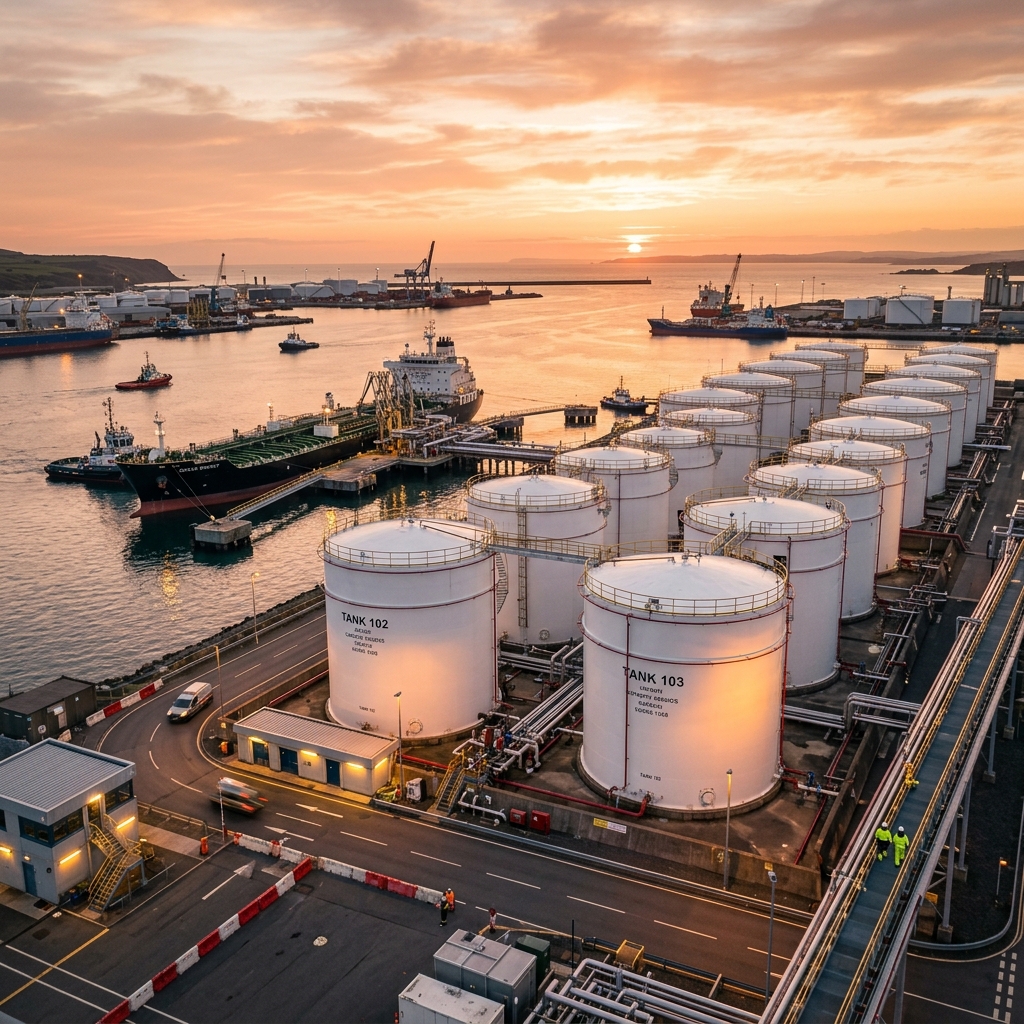
Pillar 1: Jorf Lasfar Terminal

Design, construction, and operation of a primary fuel and LPG storage facility at the strategic Jorf Lasfar port.

Service Station

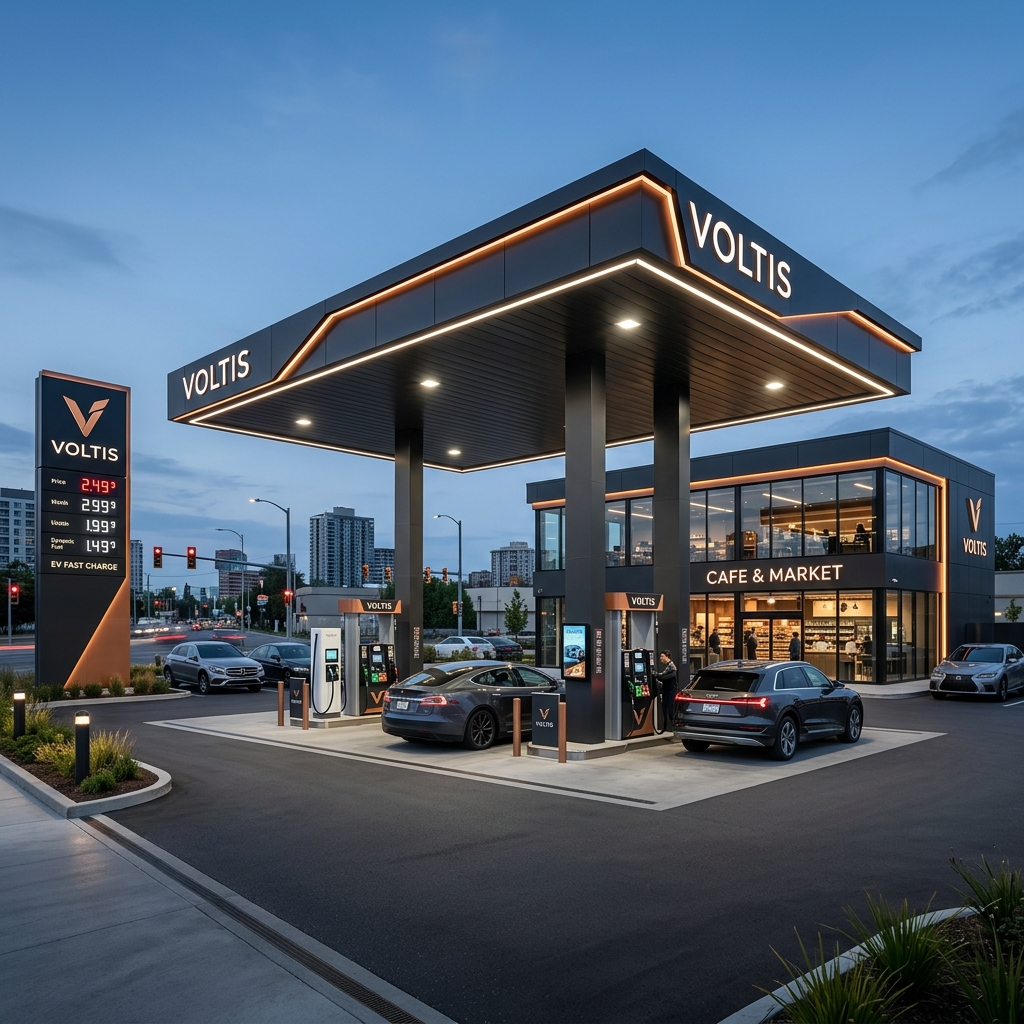
Pillar 2: Retail Distribution Network

Nationwide deployment and operation of a highly visible network of 50 branded service stations.

Storage Infrastructure (Jorf Lasfar)

Total Storage Capacity: 90,000 m³

Capacity Breakdown

  • Fuels (74,000 m³):
    • Gasoil: 62,000 m³ (2 cavities)
    • Unleaded Petrol: 12,000 m³ (2 cavities)
  • LPG (16,000 m³):
    • Butane: 14,000 m³ (2 spheres)
    • Propane: 2,000 m³ (1 sphere)

Storage CAPEX Budget

Fuel Facilities: 318.46 M MAD

LPG Facilities: 130.55 M MAD


Total Storage (Exc. VAT)

449.01 M MAD

(538.82 M MAD Inc. VAT)

Retail Service Station Network

50

Active Stations

40% Greater Casablanca

20 stations | Budget: 110 M MAD

60% Nationwide

30 stations | Budget: 90 M MAD

Total Network CAPEX: 200 M MAD (Exc. VAT)

Commercial Agreements

Logistics

Mandatory Exclusivity

The JV is strictly bound to source 100% of its refined petroleum products and fuel inventory directly from Avant-Garde Commodities.

10-Year Renewable Term

Highly Favorable Payment

Payment settled via standard corporate bank transfers within 90 days of the invoice date.

  • No Letters of Credit (LCs)
  • No Bank Guarantees required

Governance & Decision Making

Handshake

Board of Directors

Equal representation from both parties guaranteeing a 50/50 voting control.

Law & Arbitration

Governing Law: Moroccan Law

Arbitration: CIMAC or ICC (Casablanca)

Unanimous Approval Required

  • Final approval of the total estimated construction budget (Jorf Lasfar + Stations).
  • Any alteration to the 40% Casablanca / 60% Nationwide distribution ratio.
  • Any changes to the open-term credit limits allocated by Avant-Garde Commodities.

Financial Summary (Total Investment)

Key Assumption: 1 USD = 9.36 MAD

Asset Category Amount (Exc. VAT)
LPG Storage Facility 130.55 M MAD
Fuel Storage Facility 318.46 M MAD
Service Stations Network 200.00 M MAD
Grand Total Project Investment 649.01 M MAD

(* 778.82 Million MAD Inc. VAT)

Key Financial Metrics

Projected performance based on 10-year financial model (in MAD)

Revenue (Year 1)

~103 M MAD

LPG Storage Operations

Revenue (Year 5)

~174 M MAD

5% Annual Growth Target

EBITDA (Year 1)

~155 M MAD

High-Margin Trading Model

Gross Margin

10%

On Fuel Trading Operations

Revenue Streams

Fuel & LPG Trading Margins
Transit Fees (20 MAD/m³)
Capacity Rental (30 MAD/m³/mo)

Appendices

Financial Back-up Data

Appendix 1: Detailed Storage CAPEX Breakdown

PROJECT COMPANY
CAPITAL EXPENDITURE DETAILS
1/LPG STORAGE FACILITY
DESIGNATION UNIT AMOUNT IN MAD (EXCLUDING VAT) USD CONVERSION LOT
STORAGE SPHERE FOR LPG BUTANE ( 7000 M3 EACH) 2 UNIT 100,000,000 10,683,760.68 EQUIPMENT
STORAGE SPHERE FOR LPG PROPANE (2000 M3) 1 UNIT 15,000,000 1,602,564.10 EQUIPMENT
CONSTRUCTION AND CIVIL WORKS AGGREGATE 7,500,000 801,282.05 CIVIL WORKS
WEIGHBRIDGE AGGREGATE 350,000 37,393.16 CIVIL WORKS
MISCELLANEOUS NETWORKS AGGREGATE 3,500,000 373,931.62 NETWORKS
PIPELINE AGGREGATE 3,000,000 320,512.82 LAYOUT
GENERAL LAYOUT AGGREGATE 1,200,000 128,205.13 LAYOUT
TOTAL EXCLUDING VAT 130,550,000 13,947,649.57
VAT AT 20% RATE 26,110,000 2,789,529.91
TOTAL INCLUDING ALL TAXES 156,660,000 16,737,179.49
2/FUEL STORAGE FACILITY
DESIGNATION UNIT AMOUNT IN MAD (EXCLUDING VAT) USD CONVERSION LOT
STORAGE SPHERE FOR FUEL  ( 100000 M3 ) AGGREGATE 306,666,666.67 32,763,532.76 EQUIPMENT
CONSTRUCTION AND CIVIL WORKS AGGREGATE 5,333,333.33 569,800.57 CIVIL WORKS
WEIGHBRIDGE AGGREGATE 466,666.67 49,857.55 CIVIL WORKS
MISCELLANEOUS NETWORKS AGGREGATE 266,666.67 28,490.03 NETWORKS
PIPELINE AGGREGATE 5,333,333.33 569,800.57 LAYOUT
GENERAL LAYOUT AGGREGATE 400,000 42,735.04 LAYOUT
TOTAL (Exc. VAT) 318,466,666.67 34,024,216.52
VAT 20% 63,693,333.33 6,804,843.30
TOTAL (Inc. VAT) 382,160,000 40,829,059.83
TOTAL PROJECT CAPEX
TOTAL (Exc. VAT) 449,016,666.67 47,971,866.10
VAT 20% 89,803,333.33 9,594,373.22
TOTAL (Inc. VAT) 538,820,000 57,566,239.32
STORAGE CAPACITY DETAILS
PRODUCTS STORAGE CAPACITY MEASUREMENT UNIT SPHERE OF 7000 M3 SPHERE OF 2000 M3 CAVITY OF 25000 M3 CAVITY OF 6000 M3
BUTANE 14,000 M3 2 0 0 0
PROPANE 2,000 M3 0 1 0 0
DIESEL OIL 62,000 M3 0 0 2 2
UNLEADED PETROL 12,000 M3 0 0 0 2
TOTAL STORAGE CAPACITY 90,000 M3 2 1 2 4
3/SERVICE STATIONS NETWORK
DESIGNATION UNIT AMOUNT IN MAD (EXCLUDING VAT) USD CONVERSION LOT
READY TO USE SERVICE STATIONS AROUND CASABLANCA 20 UNITS 110,000,000 11,752,136.75
READY TO USE SERVICE STATIONS ELSEWHERE 30 UNITS 90,000,000 9,615,384.62
TOTAL (Exc. VAT) 200,000,000 21,367,521.37
VAT 20% 40,000,000 4,273,504.27
TOTAL (Inc. VAT) 240,000,000 25,641,025.64

Appendix 2: Key Operational Assumptions

STORAGE FACILITY AT JORF LASFAR
ASSUMPTIONS SHEET
DESIGNATION VALUE Caption for the assumption category Business line
USD Conversion Rate 9.36 Average conversion rate of the MAD against 1 USD Conversion rate Both LPG & Fuel
Minimum contribution in income tax (rate) 0.01 to apply to the sales amount including VAT in case income is below zero taxing Both LPG & Fuel
Income tax rate 0.31 to apply to gross profit before tax taxing Both LPG & Fuel
VAT Rate for LPG & fuels 0.10 common rate is applied to both business lines taxing Both LPG & Fuel
Parafiscal tax 0.00 to apply to the total value of the cargo including all excise duties taxing Both LPG & Fuel
Tax credit 0.00 to apply to duties to be paid for the importation as a reward for any credit granted for the payment of the said taxes taxing Both LPG & Fuel
levy base for trading tax 0.03 to apply to gross assets amount taxing Both LPG & Fuel
trading tax rate 0.10 to apply to the above levy base taxing Both LPG & Fuel
Land rental 500,000 in MAD per year for the global surface opex Both LPG & Fuel
Overhead expenses 800,000 In MAD per year covering communication , insurance and miscellaneous expenses opex Both LPG & Fuel
inflation rate 0.03 percentage of rise in prices opex Both LPG & Fuel
Storage capacity (global) 74,000 in cubic metres and to be converted into metric tons using the appropriate density Operations Fuel
Average FOB PRICE GASOIL 450 PLATTS QUOTATION IN USD / MT Operations Fuel
Average FOB PRICE GASOLINE 515 PLATTS QUOTATION IN USD / MT Operations Fuel
Number of loading arms 8 Number of loading points for trucks Operations Fuel
Transport capacity for trucks 33 in cubic metres for gasoil and gasoline Operations Fuel
Truck loading time 40 in minutes of time and inform about the time it took a 20MT truck to load LPG Operations Fuel
Premium 6 IN USD / MT FOR FUEL CONTRACTS Operations Fuel
Gasoil density 0.86 average density of the product as per general contracting terms Operations Fuel
Gasoline density 0.76 average density of the product as per general contracting terms Operations Fuel
annual storage growth 0.05 annual increase in quantities stored at the facility Operations Fuel
Rental rate for storage capacity 30 in MAD/M3/month : customers should order for their spaces and sign rental contract for specific capacity in cubic metre Operations Fuel
Transit rate for cargoes 20 in MAD/M3 : service will be invoiced to customers at each delivery Operations Fuel
Gasoil segment 0.85 percentage of storage for gasoil Operations Fuel
Gasoline segment 0.15 percentage of storage for gasoline Operations Fuel
gross margin rate on fuel trading operations 0.10 general margin rate on trading operations related to fuels opex Fuel
Energy cost 10 MAD/MT based on a consumption record for similar facilities opex Fuel
Maintenance & Repair 5 MAD/MT based on maintenance plan for similar facilities opex Fuel
LPG ship's tonnage 6,000 in Metric tons designing the quantity of butane to be imported import LPG Butane
Gaz Leakage 0.02 Percentage of gaz waste generally occuring on the circuit and for which the government is settling a refund in its pricing structure for LPG Operations LPG Butane
Storage capacity per sphere 7,000 in cubic metres and to be converted into metric tons using the appropriate density Operations LPG BUTANE
number of LPG sphere Butane 2 one sphere is scheduled initially Operations LPG BUTANE
Storage capacity per sphere 4,165 Conversion of volume into tons taking into consideration density value of both butane and propane Operations LPG BUTANE
Average FOB PRICE 400 in USD / Metric Ton as per the contractual pricing formula showing quotation reference Operations LPG BUTANE
Premium 12 in USD / Metric Ton as per the contract's articles it covers both insurance and freight Operations LPG BUTANE
Ship's turn over 1 number of vessel arrival in order to fill the storage spheres import LPG BUTANE & PROPANE
Gaz Density in hot seasons 0.59 In tons per cubic metre. It allows change of capacity into metric tons which is the invoicing unit. Operations LPG BUTANE & PROPANE
Filling rate of the facility in hot seasons 0.92 safety instructions does not allow full filling of the sphere hence in hot seasons 15% of the sphere capacity will be dedicated to the gaz phase of the product Operations LPG BUTANE & PROPANE
Filling rate of the facility in cold seasons 0.97 safety instructions does not allow full filling of the sphere hence in cold seasons 10% of the sphere capacity will be dedicated to the gaz phase of the product Operations LPG BUTANE & PROPANE
turn over of the capacity filling 5 Number of times the storage facility will be filled completely per month Operations LPG BUTANE & PROPANE
annual storage growth 0.05 annual increase in quantities stored at the facility Operations LPG BUTANE & PROPANE
Number of loading arms 4 Number of loading points for trucks Operations LPG BUTANE & PROPANE
Transport capacity for trucks 20 in Metric tons for bulk LPG Operations LPG BUTANE & PROPANE
Truck loading time 40 in minutes of time and inform about the time it took a 20MT truck to load LPG Operations LPG BUTANE & PROPANE
Daily working time in hours 8 number of working hours per day Operations LPG BUTANE & PROPANE
Monthly working time in days per month 22 number of working days per month Operations LPG BUTANE & PROPANE
Transit rate in MAD / Metric Tons 90 sale price for the transit of cargo through the storage facility Operations LPG BUTANE & PROPANE
Energy cost 8 MAD/MT based on a consumption record for similar facilities opex LPG BUTANE & PROPANE
Maintenance & Repair 2.87 MAD/MT based on maintenance plan for similar facilities opex LPG BUTANE & PROPANE
Staff expenses 1,700,400 see opex details for the composition of staff. Annual charges opex LPG BUTANE & PROPANE
turn over of the capacity filling 2 Number of times the storage facility will be filled completely per month Operations LPG BUTANE & PROPANE
Staff expenses 2,152,800 see opex details for the composition of staff. Annual charges opex LPG BUTANE & PROPANE
Storage capacity rental rate (in MAD/M3/MONTH) 30 opex LPG BUTANE & PROPANE
LPG ship's tonnage 1,190 in Metric tons designing the quantity of propane to be imported import LPG PROPANE
Storage capacity per sphere 2,000 in cubic metres and to be converted into metric tons using the appropriate density Operations LPG PROPANE
number of LPG sphere Propane 1 one sphere is scheduled initially Operations LPG BUTANE
Storage capacity (gasoil) 62,000 in cubic metres and to be converted into metric tons using the appropriate density Operations Fuel
Storage capacity (gasoline) 12,000 in cubic metres and to be converted into metric tons using the appropriate density Operations Fuel
Storage capacity (gasoil) 72,093.02 in metric tons Operations Fuel
Storage capacity (gasoline) 15,789.47 in metric tons Operations Fuel
turn over of the capacity filling 0.33 Number of times the storage facility will be filled completely per month : Once in 3 months Operations Fuel
Fuel Leakage 0.00 Percentage of fuel gains due to change in density and weather conditions Operations Fuel
average annual growth for service stations network 0.02 Percentage of growth in orders by service stations Operations service stations
Energy cost 20 MAD/M3 based on a consumption record for similar facilities opex service stations
Maintenance & Repair 40 MAD/m3 based on maintenance plan for similar facilities opex service stations
Overhead expenses 1,000,000 In MAD per year covering communication , insurance and miscellaneous expenses opex service stations
Supporting HR Structure 3,000,000 In MAD per year covering supporting services like accounting , finance , sales force , marketing and technical department opex service stations

Appendix 3: Price Structure & Margins

PRICE STRUCTURES FOR LPG AND FUELS
LPG BUTANE
DESIGNATION VALUE UNIT
FOB PRICE FOR IMPORTED BUTANE IN USD 400 USD/MT
MAD/FOB Price Conversion 3,744 MAD/MT
PREMIUM IN USD / MT 12 USD/MT
PORT TAXES 36.29 MAD/MT
Approach costs (Variable part) 70.07 MAD/MT
Approach costs (Fixed part) 26.60 MAD/MT
Parafiscal tax levy 9.73 MAD/MT
STORAGE FEE 130 MAD/MT
VOLATILITY MARGIN 150 MAD/MT
COST OF IMPORTED BUTANE 3,999.01 MAD/MT
SALE PRICE FOR FILLING PLANTS 4,279.01 MAD/MT
GROSS MARGIN FROM TRADING OPERATIONS 280 MAD/MT
LPG PROPANE
DESIGNATION VALUE UNIT
COST OF IMPORTED PROPANE 7,408.60 MAD/MT
SALE PRICE FOR FILLING PLANTS 8,716 MAD/MT
GROSS MARGIN FROM TRADING OPERATIONS 1,307.40 MAD/MT
FUELS : GASOIL AND GASOLINE
DESIGNATION GASOIL GASOLINE
FOB PRICE 450 515 USD /MT
PREMIUM 6 6 USD /MT
TOTAL PRICE 456 521 USD /MT
AGAINST VALUE FOR 1 MT 4,268.16 4,876.56 MAD/MT
AGAINST VALUE FOR 1 M3 4,962.98 6,416.53 MAD/M3
EXCISE DUTY 2,422 3,764 MAD/M3
VAT ON BOTH TOTAL PRICE AND EXCISE DUTY 738.50 1,018.05
TAX CREDIT (0,41% OF EXCISE DUTY + VAT) 12.96 19.61
PARAFISCAL TAX 20.34 28.05
TOTAL COST OF IMPORTED FUELS 7,418.28 10,228.18
SALE PRICE TO DISTRIBUTION CUSTOMERS 8,160.10 11,251.00
GROSS MARGIN ON TRADING OPERATIONS 741.83 1,022.82

Appendix 4: Sales Projections

DETAILS FOR THE CALCULATION OF SALES (In USD)
LPG BUSINESS LINE :
BUTANE
SALES Year 1 Year 2 Year 3 Year 4 Year 5 Year 6 Year 7 Year 8 Year 9 Year 10
IMPORT VOLUME IN MT 72,000 75,600 79,380 83,349 87,516.45 91,892.27 96,486.89 101,311.23 106,376.79 111,695.63
Revenues : 34,804,528.27 37,570,822.13 39,438,270.93 41,398,759.40 43,456,929.54 45,617,655.15 47,886,053.42 50,267,497.06 52,767,627.12 55,392,366.34
Butane Trading 32,915,450.04 35,598,059.22 37,377,962.18 39,246,860.29 41,209,203.30 43,269,663.47 45,433,146.64 47,704,803.97 50,090,044.17 52,594,546.38
storage transit fees 538,461.54 554,615.38 571,253.85 588,391.46 606,043.21 624,224.50 642,951.24 662,239.77 682,106.97 702,570.18
storage fees 692,307.69 726,923.08 763,269.23 801,432.69 841,504.33 883,579.54 927,758.52 974,146.45 1,022,853.77 1,073,996.46
Technical gains of cargo 658,309.00 691,224.45 725,785.67 762,074.96 800,178.70 840,187.64 882,197.02 926,306.87 972,622.22 1,021,253.33
PROPANE
SALES Year 1 Year 2 Year 3 Year 4 Year 5 Year 6 Year 7 Year 8 Year 9 Year 10
IMPORT VOLUME IN MT 71,400 74,970 78,718.50 82,654.43 86,787.15 91,126.50 95,682.83 100,466.97 105,490.32 110,764.83
Revenues : 68,580,646.15 74,124,120.19 77,828,741.59 81,718,546.51 85,802,792.72 90,091,200.80 94,593,977.34 99,321,839.21 104,286,039.06 109,498,392.13
Propane Trading 66,487,435.90 71,906,161.92 75,501,470.02 79,276,543.52 83,240,370.70 87,402,389.23 91,772,508.69 96,361,134.13 101,179,190.83 106,238,150.38
storage transit fees 76,923.08 79,230.77 81,607.69 84,055.92 86,577.60 89,174.93 91,850.18 94,605.68 97,443.85 100,367.17
storage fees 686,538.46 742,491.35 779,615.91 818,596.71 859,526.54 902,502.87 947,628.02 995,009.42 1,044,759.89 1,096,997.88
Technical gains of cargo 1,329,748.72 1,396,236.15 1,466,047.96 1,539,350.36 1,616,317.88 1,697,133.77 1,781,990.46 1,871,089.98 1,964,644.48 2,062,876.71
FUEL BUSINESS LINE :
GASOIL
SALES Year 1 Year 2 Year 3 Year 4 Year 5 Year 6 Year 7 Year 8 Year 9 Year 10
IMPORT VOLUME IN M3 248,000 260,400 273,420 287,091 301,445.55 316,517.83 332,343.72 348,960.90 366,408.95 384,729.40
Revenues : 219,230,503.10 236,974,981.41 248,774,607.40 261,162,741.01 274,168,763.38 287,823,523.44 302,159,411.16 317,210,434.60 333,012,300.81 349,602,500.66
Gasoil Trading 216,207,869.25 233,828,810.60 245,520,251.12 257,796,263.68 270,686,076.87 284,220,380.71 298,431,399.74 313,352,969.73 329,020,618.22 345,471,649.13
storage transit fees 2,384,615.38 2,456,153.85 2,529,838.46 2,605,733.62 2,683,905.62 2,764,422.79 2,847,355.48 2,932,776.14 3,020,759.42 3,111,382.21
storage fees 529,914.53 573,102.56 601,757.69 631,845.58 663,437.86 696,609.75 731,440.24 768,012.25 806,412.86 846,733.50
Technical gains of cargo 108,103.93 116,914.41 122,760.13 128,898.13 135,343.04 142,110.19 149,215.70 156,676.48 164,510.31 172,735.82
GASOLINE
SALES Year 1 Year 2 Year 3 Year 4 Year 5 Year 6 Year 7 Year 8 Year 9 Year 10
IMPORT VOLUME IN M3 48,000 50,400 52,920 55,566 58,344.30 61,261.51 64,324.59 67,540.82 70,917.86 74,463.75
Revenues : 63,247,439.36 68,179,625.67 71,499,614.95 74,982,933.94 78,637,669.03 82,472,308.52 86,495,762.66 90,717,384.68 95,146,992.81 99,794,893.52
Gasoil Trading 57,697,415.46 62,399,754.82 65,519,742.56 68,795,729.69 72,235,516.17 75,847,291.98 79,639,656.58 83,621,639.41 87,802,721.38 92,192,857.45
storage transit fees 4,320,000 4,449,600 4,583,088 4,720,580.64 4,862,198.06 5,008,064.00 5,158,305.92 5,313,055.10 5,472,446.75 5,636,620.15
storage fees 960,000 1,038,240 1,090,152 1,144,659.60 1,201,892.58 1,261,987.21 1,325,086.57 1,391,340.90 1,460,907.94 1,533,953.34
Technical gains of cargo 270,023.90 292,030.85 306,632.40 321,964.01 338,062.22 354,965.33 372,713.59 391,349.27 410,916.74 431,462.57
IMPORT VOLUME IN M3 296,000 310,800 326,340 342,657 359,789.85 377,779.34 396,668.31 416,501.73 437,326.81 459,193.15
Revenues : 282,477,942.46 305,154,607.08 320,274,222.36 336,145,674.95 352,806,432.41 370,295,831.96 388,655,173.82 407,927,819.28 428,159,293.62 449,397,394.18
TOTAL SALES REVENUES RELATED TO THE STORAGE BUSINESS UNIT
financial years Year 1 Year 2 Year 3 Year 4 Year 5 Year 6 Year 7 Year 8 Year 9 Year 10
Revenues : 385,863,116.89 416,849,549.40 437,541,234.87 459,262,980.86 482,066,154.67 506,004,687.91 531,135,204.58 557,517,155.55 585,212,959.80 614,288,152.65
Cargo trading 373,308,170.65 403,732,786.55 423,919,425.88 445,115,397.18 467,371,167.03 490,739,725.39 515,276,711.65 541,040,547.24 568,092,574.60 596,497,203.33
Storage capacity rental 7,320,000 7,539,600 7,765,788 7,998,761.64 8,238,724.49 8,485,886.22 8,740,462.81 9,002,676.69 9,272,757.00 9,550,939.71
storage transit fees 2,868,760.68 3,080,756.99 3,234,794.84 3,396,534.58 3,566,361.31 3,744,679.37 3,931,913.34 4,128,509.01 4,334,934.46 4,551,681.18
Technical gains of cargo 2,366,185.56 2,496,405.86 2,621,226.16 2,752,287.46 2,889,901.84 3,034,396.93 3,186,116.77 3,345,422.61 3,512,693.74 3,688,328.43
SERVICE STATIONS NETWORK OPERATIONS
SALES Year 1 Year 2 Year 3 Year 4 Year 5 Year 6 Year 7 Year 8 Year 9 Year 10
FUEL SALES VOLUMES 186,000 189,720 193,514.40 197,384.69 201,332.38 205,359.03 209,466.21 213,655.53 217,928.64 222,287.22
Number of service stations around Greater Casablanca 20 20 20 20 20 20 20 20 20 20
Number of service stations elsewhere 30 30 30 30 30 30 30 30 30 30
Average fuel order per month by service stations around casablanca 400 408 416.16 424.48 432.97 441.63 450.46 459.47 468.66 478.04
Average fuel order per month by service stations elsewhere 250 255 260.10 265.30 270.61 276.02 281.54 287.17 292.91 298.77
AVERAGE MARGIN IN MAD / M3 650 650 650 650 650 650 650 650 650 650
LUBRICANT SALES IN KG 600,000 612,000 624,240 636,724.80 649,459.30 662,448.48 675,697.45 689,211.40 702,995.63 717,055.54
Lubricant order in kg 12,000 12,240 12,484.80 12,734.50 12,989.19 13,248.97 13,513.95 13,784.23 14,059.91 14,341.11
unit margin for lubricant sales 5 5 5 5 5 5 5 5 5 5
Revenues : 13,782,051.28 14,057,692.31 14,338,846.15 14,625,623.08 14,918,135.54 15,216,498.25 15,520,828.21 15,831,244.78 16,147,869.67 16,470,827.07
FUELS SALES MARGIN 12,916,666.67 13,175,000 13,438,500 13,707,270 13,981,415.40 14,261,043.71 14,546,264.58 14,837,189.87 15,133,933.67 15,436,612.34
LUBRICANT MARGIN 320,512.82 326,923.08 333,461.54 340,130.77 346,933.38 353,872.05 360,949.49 368,168.48 375,531.85 383,042.49
SERVICES MARGIN 224,358.97 228,846.15 233,423.08 238,091.54 242,853.37 247,710.44 252,664.65 257,717.94 262,872.30 268,129.74
STORES MARGIN 320,512.82 326,923.08 333,461.54 340,130.77 346,933.38 353,872.05 360,949.49 368,168.48 375,531.85 383,042.49
TOTAL SALES REVENUES RELATED TO THE SERVICE STATONS NETWORK OPERATIONS BUSINESS UNIT
financial years Year 1 Year 2 Year 3 Year 4 Year 5 Year 6 Year 7 Year 8 Year 9 Year 10
Revenues : 399,645,168.17 430,907,241.71 451,880,081.03 473,888,603.93 496,984,290.21 521,221,186.16 546,656,032.80 573,348,400.33 601,360,829.47 630,758,979.72

Appendix 5: OPEX & Staffing Expenses

PROJET CAPACITES DE STOCKAGE A JORF LASFAR
staff expenses for lpg storage
Accounting & Tax
Corporate Income Tax Unité
IS - Cotisation minimale en % du CA 0.01 %
IS - taux d'imposition 0.31 %
Minimum Cotisation Minimale 3,000 MAD
Professional Tax / TSC
Base Imposable - Part des Immo brutes taxables 0.03
Taxe Professionnelle - Taux 0.10
TVA
Item Taux TVA Applicable
Coûts d'investissement 0.20
Coût Matières Premières 0.10
Coût Transport 0.20
Coût Energie 0.14
Coût de capsulage 0.20
Coût Maintenance 0.20
Coût Fixes externes 0.20
Chiffre d'Affaires 0.10
nbre poste net mensuel brute yc cs
1 Sphere Manager 25,000 390,000
1 QSE manager 20,000 312,000
1 maintenance Manager 20,000 312,000
4 Operating crew 6,000 374,400
2 Maintenance crew 6,000 187,200
2 Keepers 4,000 124,800
11 1,700,400
staff expenses for fuel storage
poste nbre net mensuel brute yc cs
Sphere Manager 1 20,000 312,000
QSE manager 1 15,000 234,000
maintenance Manager 1 15,000 234,000
Operating crew 8 6,000 748,800
Maintenance crew 4 6,000 374,400
Keepers 4 4,000 249,600
TOTAL GENERAL 19 66,000 2,152,800
Accounting & Tax
Corporate Income Tax Unité
IS - Cotisation minimale en % du CA 0.01 %
IS - taux d'imposition 0.31 %
Minimum Cotisation Minimale 3,000 MAD
Professional Tax / TSC
Base Imposable - Part des Immo brutes taxables 0.03
Taxe Professionnelle - Taux 0.10
TVA
Item Taux TVA Applicable
Coûts d'investissement 0.20
Coût Matières Premières 0.10
Coût Energie 0.14
Coût Maintenance 0.20
Coût Fixes externes 0.20
Chiffre d'Affaires / STOCKAGE & PASSAGE 0.20
Chiffre d'Affaires / COULAGE 0.10
staff expenses for service stations network
poste nbre net mensuel brute yc cs
service stations managers 50 8,000 6,240,000
pump man 120 4,000 7,488,000
store manager 50 4,000 3,120,000
service clerks 50 4,000 3,120,000
Keepers 100 3,500 5,460,000
TOTAL GENERAL 370 23,500 25,428,000
Accounting & Tax
Corporate Income Tax Unité
IS - Cotisation minimale en % du CA 0.01 %
IS - taux d'imposition 0.31 %
Minimum Cotisation Minimale 3,000 MAD
Professional Tax / TSC
Base Imposable - Part des Immo brutes taxables 0.03
Taxe Professionnelle - Taux 0.10
TVA
Item Taux TVA Applicable
Coûts d'investissement 0.20
Coût Matières Premières 0.10
Coût Energie 0.14
Coût Maintenance 0.20
Coût Fixes externes 0.20
Chiffre d'Affaires / STOCKAGE & PASSAGE 0.20
Chiffre d'Affaires / COULAGE 0.10

Appendix 6: Profit & Loss Projections

PROFIT AND LOSS STATEMENT
LPG STORAGE
Designation Year 1 Year 2 Year 3 Year 4 Year 5 Year 6 Year 7 Year 8 Year 9 Year 10
Production in MT 143,400 150,570 158,098.50 166,003.42 174,303.60 183,018.78 192,169.71 201,778.20 211,867.11 222,460.47
Revenues 103,385,174.42 111,694,942.32 117,267,012.51 123,117,305.91 129,259,722.26 135,708,855.95 142,480,030.76 149,589,336.27 157,053,666.18 164,890,758.47
Total OPEX 87,763,013.93 94,893,945.13 99,632,038.94 104,606,839.34 109,830,175.72 115,314,468.74 121,072,759.94 127,118,742.74 133,466,795.02 140,132,013.36
Cost of Goods Sold (COGS) 87,275,924.40 94,388,912.24 99,108,357.85 104,063,775.74 109,266,964.53 114,730,312.75 120,466,828.39 126,490,169.81 132,814,678.30 139,455,412.22
energy cost 122,564.10 128,692.31 135,126.92 141,883.27 148,977.43 156,426.30 164,247.62 172,460.00 181,083.00 190,137.15
maintenance cost 43,969.87 46,168.37 48,476.78 50,900.62 53,445.65 56,117.94 58,923.83 61,870.03 64,963.53 68,211.70
staff expenses 181,666.67 187,116.67 192,730.17 198,512.07 204,467.43 210,601.46 216,919.50 223,427.09 230,129.90 237,033.80
Fixed costs 138,888.89 143,055.56 147,347.22 151,767.64 156,320.67 161,010.29 165,840.60 170,815.81 175,940.29 181,218.50
taxing 41,842.95 43,098.24 43,098.24 43,098.24 43,098.24 43,098.24 43,098.24 43,098.24 43,098.24 43,098.24
EBITDA 15,580,317.55 16,757,898.95 17,591,875.33 18,467,368.33 19,386,448.30 20,351,288.98 21,364,172.58 22,427,495.30 23,543,772.92 24,715,646.87
amortization allowances 697,382.48 697,382.48 697,382.48 697,382.48 697,382.48 697,382.48 697,382.48 697,382.48 697,382.48 697,382.48
EBIT 14,882,935.07 16,060,516.47 16,894,492.86 17,769,985.85 18,689,065.83 19,653,906.50 20,666,790.11 21,730,112.82 22,846,390.45 24,018,264.39
Cost of financing 836,858.97 836,858.97 836,858.97 836,858.97 836,858.97 836,858.97 836,858.97 836,858.97 836,858.97 836,858.97
GROSS PROFIT 14,046,076.09 15,223,657.50 16,057,633.88 16,933,126.88 17,852,206.85 18,817,047.52 19,829,931.13 20,893,253.85 22,009,531.47 23,181,405.42
Corporate tax 4,354,283.59 4,719,333.82 4,977,866.50 5,249,269.33 5,534,184.12 5,833,284.73 6,147,278.65 6,476,908.69 6,822,954.76 7,186,235.68
Résultat Net 9,691,792.51 10,504,323.67 11,079,767.38 11,683,857.54 12,318,022.73 12,983,762.79 13,682,652.48 14,416,345.15 15,186,576.72 15,995,169.74
CASH FLOW FROM OPERATIONS 10,389,174.98 11,201,706.15 11,777,149.86 12,381,240.02 13,015,405.21 13,681,145.27 14,380,034.96 15,113,727.63 15,883,959.19 16,692,552.22
LPG FUELS
Designation Year 1 Year 2 Year 3 Year 4 Year 5 Year 6 Year 7 Year 8 Year 9 Year 10
Production in M3 296,000 310,800 326,340 342,657 359,789.85 377,779.34 396,668.31 416,501.73 437,326.81 459,193.15
Revenues 282,477,942.46 305,154,607.08 320,274,222.36 336,145,674.95 352,806,432.41 370,295,831.96 388,655,173.82 407,927,819.28 428,159,293.62 449,397,394.18
Total OPEX 249,848,052.15 270,191,670.62 283,693,655.04 297,870,510.70 312,755,974.34 328,385,469.31 344,796,189.90 362,027,189.95 380,119,475.71 399,116,103.55
Cost of Goods Sold (COGS) 249,004,804.28 269,298,695.83 282,763,630.62 296,901,812.15 311,746,902.76 327,334,247.90 343,700,960.29 360,886,008.31 378,930,308.72 397,876,824.16
energy cost 316,239.32 342,012.82 359,113.46 377,069.13 395,922.59 415,718.72 436,504.66 458,329.89 481,246.38 505,308.70
maintenance cost 158,119.66 171,006.41 179,556.73 188,534.57 197,961.30 207,859.36 218,252.33 229,164.94 240,623.19 252,654.35
staff expenses 230,000 236,900 244,007 251,327.21 258,867.03 266,633.04 274,632.03 282,870.99 291,357.12 300,097.83
Fixed costs 138,888.89 143,055.56 147,347.22 151,767.64 156,320.67 161,010.29 165,840.60 170,815.81 175,940.29 181,218.50
taxing 102,072.65 105,134.83 108,288.87 111,537.54 114,883.67 118,330.18 121,880.08 125,536.48 129,302.58 133,181.66
EBITDA 32,527,817.67 34,857,801.64 36,472,278.45 38,163,626.70 39,935,574.40 41,792,032.47 43,737,103.83 45,775,092.85 47,910,515.33 50,148,108.98
amortization allowances 1,701,210.83 1,701,210.83 1,701,210.83 1,701,210.83 1,701,210.83 1,701,210.83 1,701,210.83 1,701,210.83 1,701,210.83 1,701,210.83
EBIT 30,826,606.84 33,156,590.81 34,771,067.62 36,462,415.88 38,234,363.58 40,090,821.65 42,035,893.01 44,073,882.02 46,209,304.51 48,446,898.15
Cost of financing 2,041,452.99 2,041,452.99 2,041,452.99 2,041,452.99 2,041,452.99 2,041,452.99 2,041,452.99 2,041,452.99 2,041,452.99 2,041,452.99
GROSS PROFIT 28,785,153.85 31,115,137.82 32,729,614.63 34,420,962.89 36,192,910.58 38,049,368.66 39,994,440.02 42,032,429.03 44,167,851.52 46,405,445.16
Corporate tax 8,923,397.69 9,645,692.72 10,146,180.54 10,670,498.49 11,219,802.28 11,795,304.28 12,398,276.40 13,030,053.00 13,692,033.97 14,385,688.00
Net profit 19,861,756.16 21,469,445.09 22,583,434.10 23,750,464.39 24,973,108.30 26,254,064.37 27,596,163.61 29,002,376.03 30,475,817.55 32,019,757.16
CASH FLOW FROM OPERATIONS 21,562,966.98 23,170,655.92 24,284,644.92 25,451,675.22 26,674,319.13 27,955,275.20 29,297,374.44 30,703,586.86 32,177,028.37 33,720,967.99
SERVICE STATIONS NETWORK
Designation 249,004,804.28 269,298,695.83 282,763,630.62 296,901,812.15 311,746,902.76 327,334,247.90 343,700,960.29 360,886,008.31 378,930,308.72 397,876,824.16
Production in M3 186,000 189,720 193,514.40 197,384.69 201,332.38 205,359.03 209,466.21 213,655.53 217,928.64 222,287.22
Revenues 13,782,051.28 14,057,692.31 14,338,846.15 14,625,623.08 14,918,135.54 15,216,498.25 15,520,828.21 15,831,244.78 16,147,869.67 16,470,827.07
Total OPEX 4,436,324.79 4,581,814.53 4,706,864.20 4,835,417.26 4,967,573.85 5,103,437.03 5,243,112.82 5,386,710.34 5,534,341.86 5,686,122.94
Consumables for the stations 100,000 103,000 106,090 109,272.70 112,550.88 115,927.41 119,405.23 122,987.39 126,677.01 130,477.32
energy cost 397,435.90 405,384.62 413,492.31 421,762.15 430,197.40 438,801.34 447,577.37 456,528.92 465,659.50 474,972.69
maintenance cost 794,871.79 835,092.31 851,794.15 868,830.04 886,206.64 903,930.77 922,009.39 940,449.57 959,258.57 978,443.74
staff expenses 2,716,666.67 2,798,166.67 2,882,111.67 2,968,575.02 3,057,632.27 3,149,361.24 3,243,842.07 3,341,157.33 3,441,392.05 3,544,633.82
Fixed costs 427,350.43 440,170.94 453,376.07 466,977.35 480,986.67 495,416.27 510,278.76 525,587.12 541,354.74 557,595.38
taxing 64,102.56 66,025.64 68,006.41 70,046.60 72,148.00 74,312.44 76,541.81 78,838.07 81,203.21 83,639.31
EBITDA 9,281,623.93 9,409,852.14 9,563,975.55 9,720,159.22 9,878,413.68 10,038,748.78 10,201,173.58 10,365,696.37 10,532,324.60 10,701,064.82
amortization allowances 1,068,376.07 1,068,376.07 1,068,376.07 1,068,376.07 1,068,376.07 1,068,376.07 1,068,376.07 1,068,376.07 1,068,376.07 1,068,376.07
EBIT 8,213,247.86 8,341,476.07 8,495,599.48 8,651,783.15 8,810,037.62 8,970,372.71 9,132,797.51 9,297,320.31 9,463,948.53 9,632,688.76
Cost of financing 4,000,000 4,000,000 4,000,000 4,000,000 4,000,000 4,000,000 4,000,000 4,000,000 4,000,000 4,000,000
GROSS PROFIT 4,213,247.86 4,341,476.07 4,495,599.48 4,651,783.15 4,810,037.62 4,970,372.71 5,132,797.51 5,297,320.31 5,463,948.53 5,632,688.76
Corporate tax 1,306,106.84 1,345,857.58 1,393,635.84 1,442,052.78 1,491,111.66 1,540,815.54 1,591,167.23 1,642,169.29 1,693,824.05 1,746,133.51
Net profit 2,907,141.03 2,995,618.49 3,101,963.64 3,209,730.37 3,318,925.95 3,429,557.17 3,541,630.28 3,655,151.01 3,770,124.49 3,886,555.24
CASH FLOW FROM OPERATIONS 3,975,517.09 4,063,994.56 4,170,339.71 4,278,106.44 4,387,302.02 4,497,933.24 4,610,006.35 4,723,527.08 4,838,500.56 4,954,931.31
SUMMARY OF THE FINANCIAL FORECAST
Designation Year 1 Year 2 Year 3 Year 4 Year 5 Year 6 Year 7 Year 8 Year 9 Year 10
Revenues 399,645,168.17 430,907,241.71 451,880,081.03 473,888,603.93 496,984,290.21 521,221,186.16 546,656,032.80 573,348,400.33 601,360,829.47 630,758,979.72
Total OPEX 342,047,390.86 369,667,430.28 388,032,558.18 407,312,767.30 427,553,723.91 448,803,375.07 471,112,062.66 494,532,643.02 519,120,612.58 544,934,239.84
taxing 208,018.16 214,258.71 219,393.52 224,682.38 230,129.90 235,740.85 241,520.13 247,472.79 253,604.03 259,919.20
EBITDA 57,389,759.15 61,025,552.73 63,628,129.33 66,351,154.25 69,200,436.39 72,182,070.23 75,302,450.00 78,568,284.52 81,986,612.86 85,564,820.67
amortization allowances 3,466,969.37 3,466,969.37 3,466,969.37 3,466,969.37 3,466,969.37 3,466,969.37 3,466,969.37 3,466,969.37 3,466,969.37 3,466,969.37
EBIT 53,922,789.78 57,558,583.35 60,161,159.96 62,884,184.88 65,733,467.02 68,715,100.86 71,835,480.63 75,101,315.15 78,519,643.49 82,097,851.30
Cost of financing 6,878,311.97 6,878,311.97 6,878,311.97 6,878,311.97 6,878,311.97 6,878,311.97 6,878,311.97 6,878,311.97 6,878,311.97 6,878,311.97
GROSS PROFIT 47,044,477.81 50,680,271.39 53,282,847.99 56,005,872.91 58,855,155.05 61,836,788.89 64,957,168.66 68,223,003.19 71,641,331.52 75,219,539.33
Corporate tax 14,583,788.12 15,710,884.13 16,517,682.88 17,361,820.60 18,245,098.07 19,169,404.56 20,136,722.28 21,149,130.99 22,208,812.77 23,318,057.19
Net profit 29,553,548.66 31,973,768.77 33,663,201.47 35,434,321.94 37,291,131.03 39,237,827.17 41,278,816.09 43,418,721.19 45,662,394.26 48,014,926.90
CASH FLOW FROM OPERATIONS 31,952,141.97 34,372,362.07 36,061,794.78 37,832,915.24 39,689,724.33 41,636,420.47 43,677,409.40 45,817,314.49 48,060,987.57 50,413,520.20

Appendix 7: Projected Cash Flow Statement

CASH FLOW STATEMENT
Designation Year 1 Year 2 Year 3 Year 4 Year 5 Year 6 Year 7 Year 8 Year 9 Year 10
CASH FLOW FROM OPERATIONS 31,952,141.97 34,372,362.07 36,061,794.78 37,832,915.24 39,689,724.33 41,636,420.47 43,677,409.40 45,817,314.49 48,060,987.57 50,413,520.20
INVESTING ACTIVITIES -22,450,833.33 -22,675,341.67 -22,902,095.08 -23,131,116.03 -23,362,427.19 -23,596,051.47 -23,832,011.98 -24,070,332.10 -24,311,035.42 -24,554,145.78
Sale of property & equipment 0 0 0 0 0 0 0 0 0 0
Purchase of property & equipment -22,450,833.33 -22,675,341.67 -22,902,095.08 -23,131,116.03 -23,362,427.19 -23,596,051.47 -23,832,011.98 -24,070,332.10 -24,311,035.42 -24,554,145.78
FINANCING ACTIVITIES -62,748,064.60 -63,474,130.63 -63,980,960.44 -64,512,296.58 -65,069,339.31 -65,653,348.15 -66,265,644.83 -66,907,616.36 -67,580,718.28 -68,286,478.07
Issuance of Stock 0 0 0 0 0 0 0 0 0 0
Borrowing 0 0 0 0 0 0 0 0 0 0
Repayment of loans -53,882,000 -53,882,000 -53,882,000 -53,882,000 -53,882,000 -53,882,000 -53,882,000 -53,882,000 -53,882,000 -53,882,000
Dividend -8,866,064.60 -9,592,130.63 -10,098,960.44 -10,630,296.58 -11,187,339.31 -11,771,348.15 -12,383,644.83 -13,025,616.36 -13,698,718.28 -14,404,478.07
Net cash flow -53,246,755.96 -51,777,110.22 -50,821,260.75 -49,810,497.37 -48,742,042.17 -47,612,979.15 -46,420,247.41 -45,160,633.97 -43,830,766.13 -42,427,103.64
×

Thank You

Ready to Build Morocco's Energy Future Together